Commands
Merging Databases
Everything in DFTFIT is backed by an SQLite3 database. Often times
when running calcluations on supercomputers your calculations will be
stored in several databases. In fact this is recommended because
SQLite3 does not handle concurrency and distributed file systems well. dftfit db merge will
combine several databases into one. It can also de-duplicate
calculations.
dftfit db merge database1.db database2.db -o database.db
Evaluating Potentials
A challenging area of using potentials for molecular dynamics calculations is checking that the potential is stable for your work. DFTFIT makes this easy by taking in a potential plus the ground state structure. It will predict the:
- lattice constants
- elastic constants
- energy, forces, and stress of configuration
dftfit test properties -p test_files/potential/mgo.yaml \
                       -s test_files/structure/MgO.cif
Output:
Lattice Constants:
      a:  4.199    b:  4.199     c:  4.199
  alpha: 90.000 beta: 90.000 gamma: 90.000

Elastic:
Stiffness Tensor
  -313.8   -148.5   -179.1     -0.0     -0.0     -0.0

  -117.1   -333.8   -179.1     -0.0     -0.0     -0.0

  -117.1   -148.6   -353.2     -0.0     -0.0     -0.0

    -0.0     +0.0     -0.0   -120.7     -0.0     +0.0

    -0.0     +0.0     -0.0     -0.0   -120.7     +0.0

    -0.0     -0.0     -0.0     +0.0     -0.0   -120.7


Shear Modulus G_V -105.36002528878238
Shear Modulus G_R -106.1332136372622
Shear Modulus G_vrh -105.74661946302228
Bulk Modulus K_V -210.04961372048925
Bulk Modulus K_R -211.15489789675007
Bulk Modulus K_vrh -210.60225580861965
Elastic Anisotropy -0.04165984250465549
Poisons Ration 0.284937698051096

Static:
    Energy: [eV]
               -14.559
    Forces: [eV/Angstrom]
                 8.500           20.370           -9.638
                -8.500          -20.370            9.638
    Stress: [bars]
               118.599          211.146          -29.249
               211.146          399.328          -53.051
               -29.249          -53.051           33.288
DFTFIT will perform the calculation on the input structure so it may be important to relax it with the potential beforehand.
dftfit test relax -p test_files/potential/mgo.yaml \
                  -s test_files/structure/MgO.cif \
                  -o MgO-relaxed.cif
Summarizing DFTFIT runs
After performing many calculations you may want to quickly look through the database and look at the progress. It will print interesting features that indicate the success of the optimization.
dftfit db summary test_files/database/database.db
Output:
run: 1
      algo: pygmo.sade       steps:         21
      stats:
            mean:    1.0
            median:  1.0
            min:     1.0
      final:   -1.98,  177, 1.92,  871, 74.6, 1.82e+05, 88.2,  976
      score:   0.9999780011307999

run: 2
        algo: pygmo.sade       steps:      26248
        stats:
              mean:   0.932
              median: 0.925
              min:    0.86
        final:   -1.31, 0.741, 3.31, 12.8, 0.26, 1.47e+03, 0.404,  640
        score:   0.8522755981712459

run: 3
        algo: pygmo.sade       steps:      26248
        stats:
              mean:   0.977
              median: 0.973
              min:    0.956
        final:   -1.31, 46.6, 0.143, 20.4, 0.614, 3.67e+03, 0.397,  995
        score:   0.8908135790668292

run: 4
        algo: pygmo.sade       steps:      98366
        stats:
              mean:   0.795
              median: 0.902
              min:    0.393
        final:   1.77,  163, 0.395,  348, 0.38, 1.88e+03, 0.382,  811
        score:   0.37092898795248247

run: 5
        algo: pygmo.sade       steps:      26220
        stats:
              mean:   0.909
              median: 0.898
              min:    0.823
        final:   -1.69,  2.5, 96.5, 4.66e+03, 0.229, 1.12e+03, 0.411,  773
        score:   0.7009948887639249
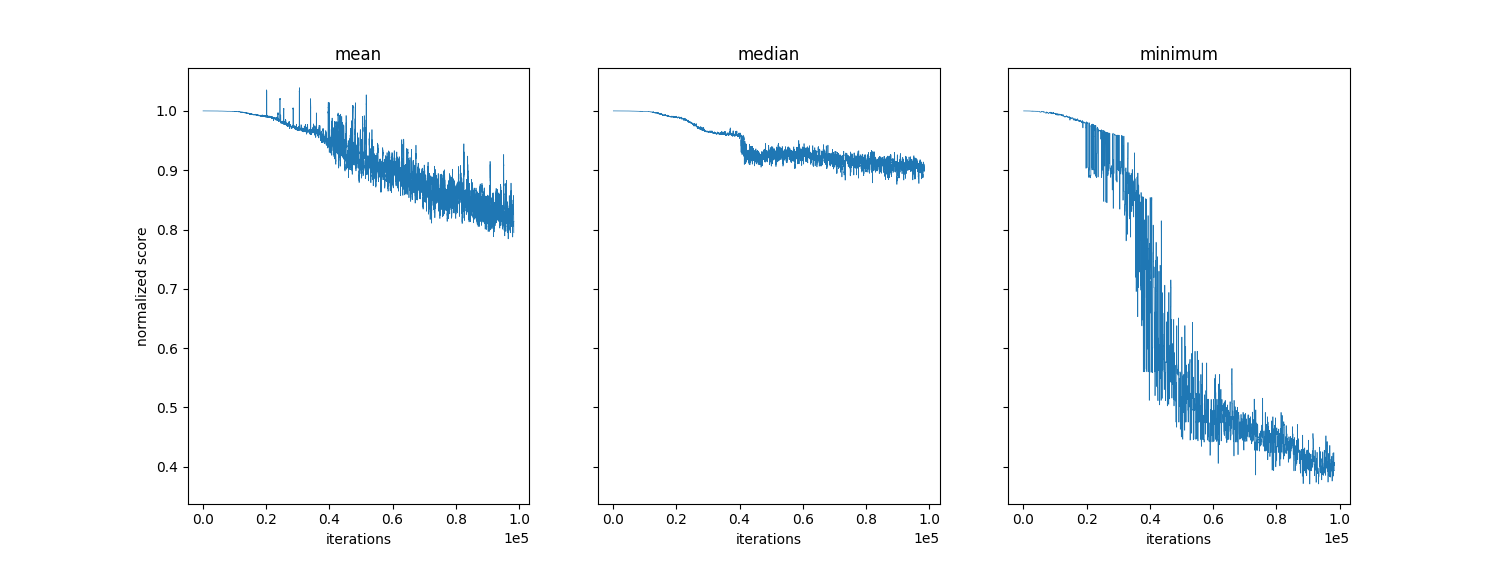
Visualize Progress of Run
The DFTFIT summary command only gives a some information about the convergence but cannot show the full progress through time. To address this you can visualize the convergence of a single run.
dftfit db progress test_files/database/database.db --run-id=4
Training Set Radial Distribution
One of DFTFIT’s main goals is to produce more transferable potentials. To enable this you can visualize the pair distribution of each atom combination. The picture below show training from 140 structures close to equilibrium indicated by the sharp peaks.
dftfit test radial -t test_files/training/training-full-mgo.yaml
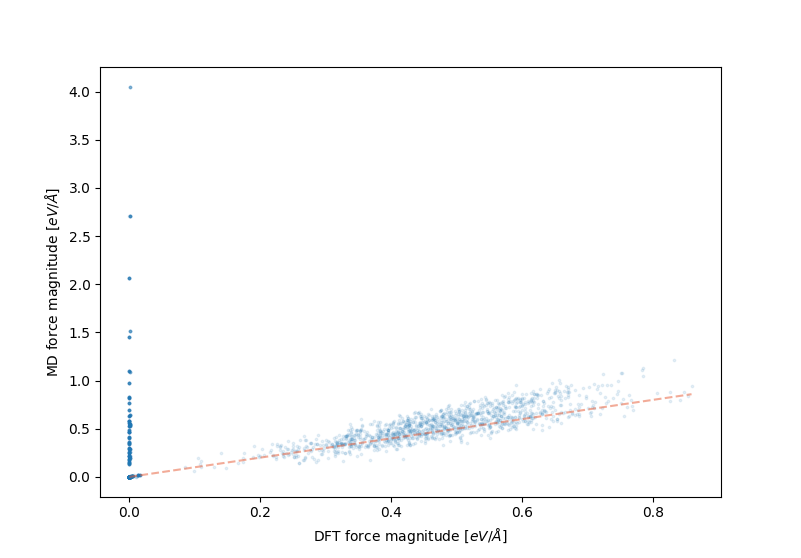
Visualize Potential Error on Training Set
So far the only indicator for progress was \(\Delta E, \Delta F, \Delta S\). It is not easy to visualize how the potential is fitting the DFT data. For this DFTFIT provides methods to visualize the error or the energy, stresses, and forces. Bellow is an example of visualizing the force error. In this image we can see that the MD predicted forces tend to be higher than the DFT forces. The red dashed line indicates a one to one match between the data.
dftfit test training forces -p test_files/potential/mgo.yaml \
                            -t test_files/training/training-full-mgo.yaml
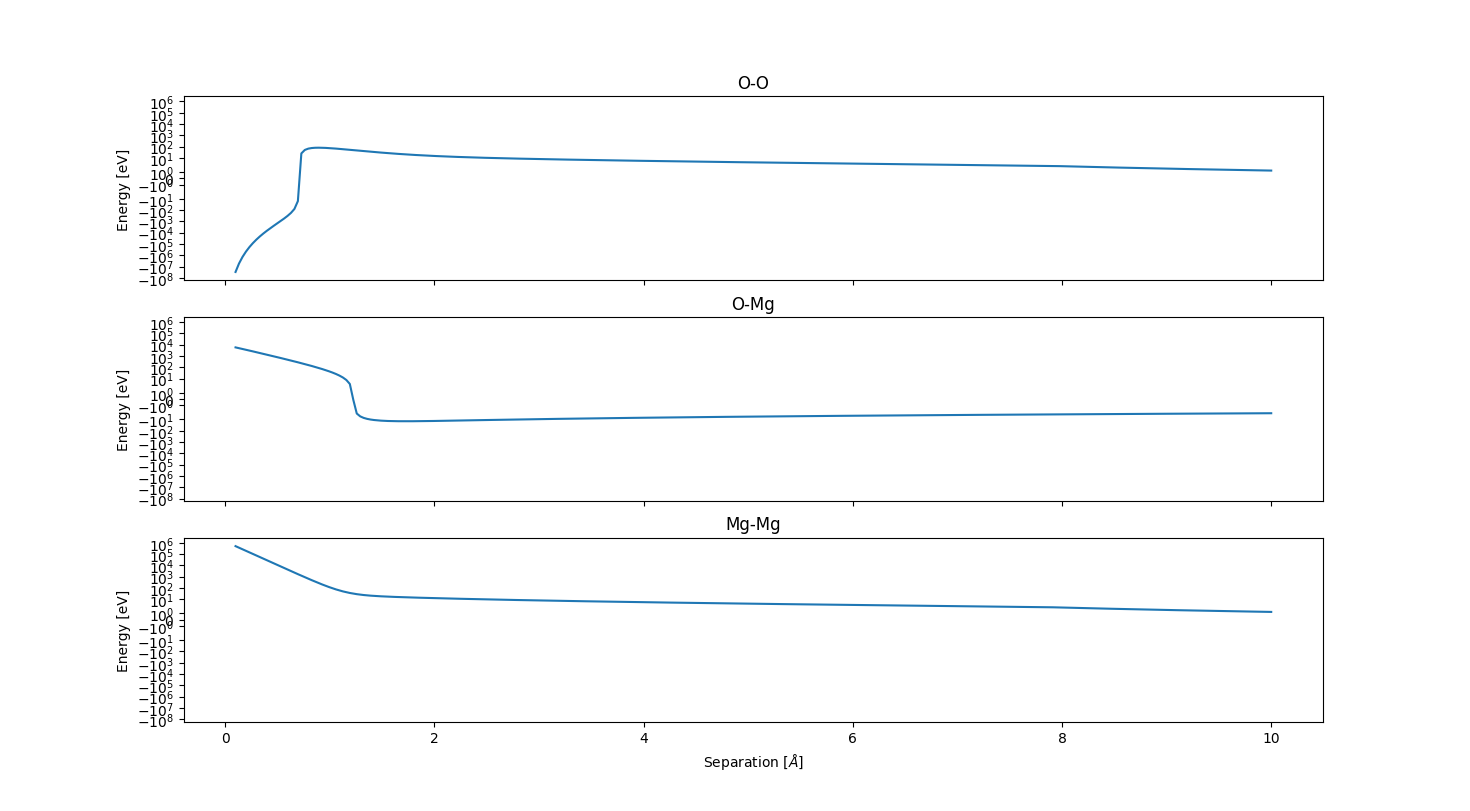
Visualize Pair Potential
Often times complex pair potentials are used in combination with three body and n body terms. This leads to a complicated pair potential interaction. This command will visualize the resulting pair potential from the model for each pair of atoms. This method just does a simple evaluation of the pair of atoms at different separations in a large periodic box (much larger than separation).
dftfit test pair -p test_files/potential/mgo.yaml